Cumulus and ocp-memprof, a love story
In this blog post, we went on the hunt of memory leaks in Cumulus by using our memory profiler: ocp-memprof. Cumulus is a feed aggregator based on Eliom, a framework for programming web sites and client/server web applications, part of the Ocsigen Project.
First, run and get the memory snapshots
To test and run the server, we use ocp-memprof to start the process:
$ ocp-memprof -exec ocsigenserver.opt -c ocsigenserver.opt.conf -v
There are several ways to obtain snapshots:
- automatically after each GC: there is nothing to do, this is the default behavior
- manually:
- by sending a SIGUSR1 signal (the default signal can be changed by using
--signal SIGoption); - by editing the source code and using the dump function in the
Headumpmodule:
(* the string argument stands for the name of the dump *) val dump : string -> unit - by sending a SIGUSR1 signal (the default signal can be changed by using
Here, we use the default behavior and get a snapshot after every GC.
The Memory Evolution Graph
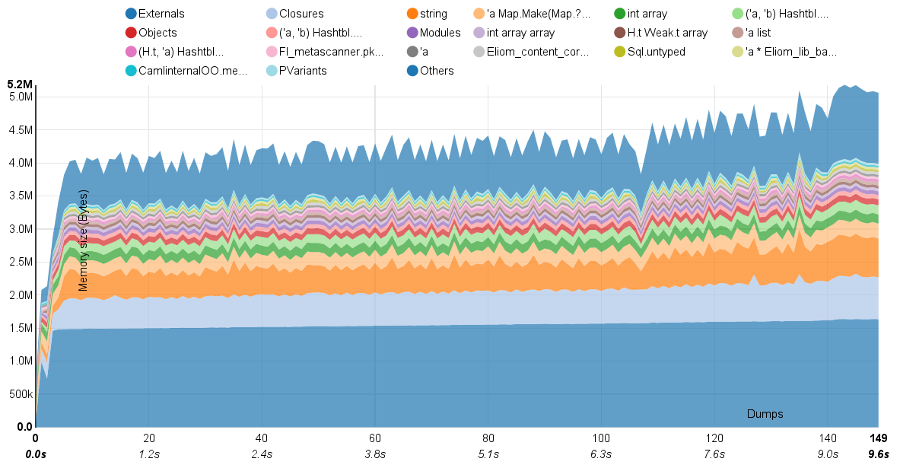
After running the server for a long time, the server process shows an unusually high consumption of memory. ocp-memprof automatically generates some statistics on the application memory usage. Below, we show the graph of memory consumption. On the x-axis, you can see the number of GCs, and on the y-axis, the memory size in bytes used by the most popular types in memory.
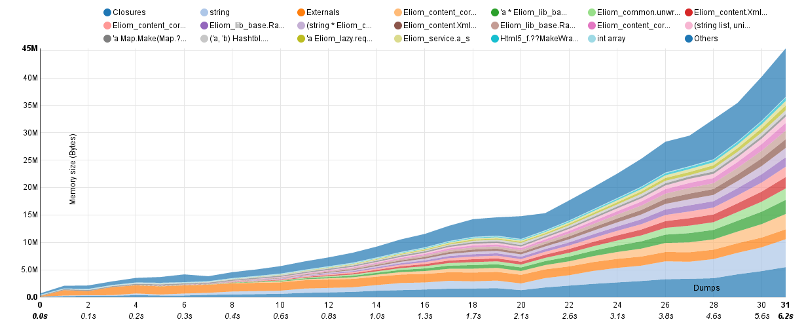
Eliom expert users would quickly identify that most of the memory is used by XML nodes and attributes, together with strings and closures.
Unfortunately, it is not that easy to know which parts of Cumulus source code are the cause for the allocations of these XML trees. These trees are indeed abstract types allocated using functions exported by the Eliom modules. The main part of the allocations are then located in the Eliom source code.
Generally, we will have a problem to locate abstract type values just using allocation points. It may be useful to browse the memory graph which can be completely reconstructed from the snapshot to identify all paths between the globals and the blocks representing XML nodes.
From roots to leaking nodes
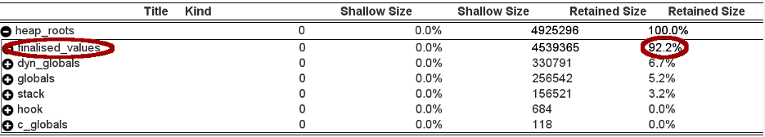
The approach that we chose to identify the leak is to take a look at the pointer graph of our application in order to identify the roots retaining a significant portion of the memory. Above, we can observe the table of the retained size, for all roots of the application. What we can tell quickly is that 92.2% of our memory is retained by values with finalizers.
Below, looking at them more closely, we can state that there is a significant amount of values of type:
[code language="fsharp" gutter="false"] 'a Eliom_comet_base.channel_data Lwt_stream.t -> unit [/code]
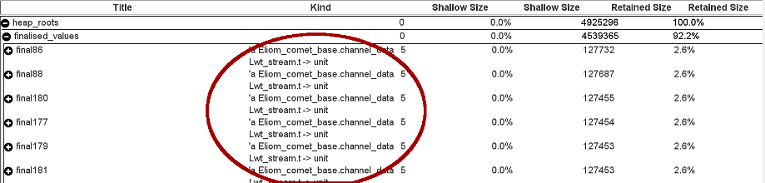
Probably, these finalizers are never called in order to free their associated values. The leak is not trivial to track down and fix. However, a quick fix is possible in the case of Cumulus.
Identifying the source code and patching it
After further investigation into the source code of Cumulus, we found the only location where such values are allocated:
(* $ROOT/cumulus/src/base/feeds.ml *)
let (event , call_event ) =
let ( private_event , call_event ) = React.E. create () in
let event = Eliom_react .Down. of_react private_event in
(event , call_event )
The function of_react takes an optional argument ~scope to specify the way that Eliom_comet.Channel.create has to use the communication channel.
Changing the default value of the scope by another given in Eliom module, we have now only one channel and every client use this channel to communicate with the server (the default method created one channel by client).
(* $ROOT/cumulus/src/base/feeds.ml *)
let (event , call_event ) =
let ( private_event , call_event ) = React.E. create () in
let event = Eliom_react .Down. of_react
~scope : Eliom_common . site_scope private_event in
(event , call_event )let (event , call_event ) =
Checking the fix
After patching the source code, we recompile our application and re-execute the process as before. Below, we can observe the new pointer graph. By changing the default value of scope, the size retained by finalizers drops from 92.2% to 0% !
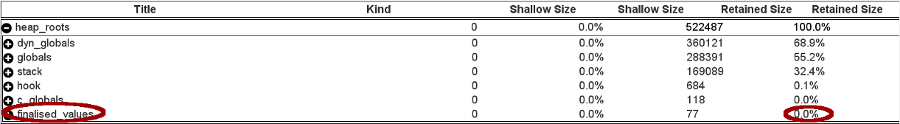
The new evolution graph below shows that the memory usage drops from 45Mb (still growing quickly) for a few hundreds connections to 5.2Mb for thousands connections.
Conclusion
As a reminder, a finalisation function is a function that will be called with the (heap-allocated) value to which it is associated when that value becomes unreachable.
The GC calls finalisation functions in order to deallocate their associated values. You need to pay special attention when writing such finalisation functions, since anything reachable from the closure of a finalisation function is considered reachable. You also need to be careful not to make the value, that you want to free, become reachable again.
This example is online in our gallery of examples if you want to see and explore the graphs (with the leak and without the leak).
Do not hesitate to use ocp-memprof on your applications. Of course, all feedback and suggestions on using ocp-memprof are welcome, just send us a mail !
More information:
- Homepage: https://memprof.typerex.org/
- Usage: https://memprof.typerex.org/free-version.php
- Support: https://memprof.typerex.org/report-a-bug.php
- Gallery of examples: https://memprof.typerex.org/gallery.php
- Commercial: https://memprof.typerex.org/commercial-version.php
About OCamlPro:
OCamlPro is a R&D lab founded in 2011, with the mission to help industrial users benefit from experts with a state-of-the-art knowledge of programming languages theory and practice.
- We provide audit, support, custom developer tools and training for both the most modern languages, such as Rust, Wasm and OCaml, and for legacy languages, such as COBOL or even home-made domain-specific languages;
- We design, create and implement software with great added-value for our clients. High complexity is not a problem for our PhD-level experts. For example, we helped the French Income Tax Administration re-adapt and improve their internally kept M language, we designed a DSL to model and express revenue streams in the Cinema Industry, codename Niagara, and we also developed the prototype of the Tezos proof-of-stake blockchain from 2014 to 2018.
- We have a long history of creating open-source projects, such as the Opam package manager, the LearnOCaml web platform, and contributing to other ones, such as the Flambda optimizing compiler, or the GnuCOBOL compiler.
- We are also experts of Formal Methods, developing tools such as our SMT Solver Alt-Ergo (check our Alt-Ergo Users' Club) and using them to prove safety or security properties of programs.
Please reach out, we'll be delighted to discuss your challenges: contact@ocamlpro.com or book a quick discussion.
Most Recent Articles
2025
2024
- opam 2.3.0 release!
- Optimisation de Geneweb, 1er logiciel français de Généalogie depuis près de 30 ans
- Alt-Ergo 2.6 is Out!
- Flambda2 Ep. 3: Speculative Inlining
- opam 2.2.0 release!
- Flambda2 Ep. 2: Loopifying Tail-Recursive Functions
- Fixing and Optimizing the GnuCOBOL Preprocessor
- OCaml Backtraces on Uncaught Exceptions
- Opam 102: Pinning Packages
- Flambda2 Ep. 1: Foundational Design Decisions
- Behind the Scenes of the OCaml Optimising Compiler Flambda2: Introduction and Roadmap
- Lean 4: When Sound Programs become a Choice
- Opam 101: The First Steps
2023